Documentation Index
Fetch the complete documentation index at: https://trunk-4cab4936-sam-gutentag-test-error-debugging.mintlify.app/llms.txt
Use this file to discover all available pages before exploring further.
Trunk Flaky Tests detects flaky tests by analyzing test results. The health of your tests is displayed in the Flaky Tests dashboard.
Repositories overview
When you navigate to /<your-org>/flaky-tests, you land on a repositories overview showing all monitored repositories at a glance.
Each repository row displays:
| Column | Description |
|---|
| Tests | Total tracked test cases in the repository (60-day window) |
| Flaky | Number of currently flaky test cases, with a 10-day trend sparkline |
| Broken | Number of currently broken test cases, with a 10-day trend sparkline |
| Runs / Day | Bar chart of test run volume over the last 10 days, with per-day tooltips |
| Icon | Meaning |
|---|
| Shield | Quarantining is enabled for this repository — auto-quarantine is off |
| Shield with checkmark | Auto-quarantine is enabled — flaky tests are quarantined automatically |
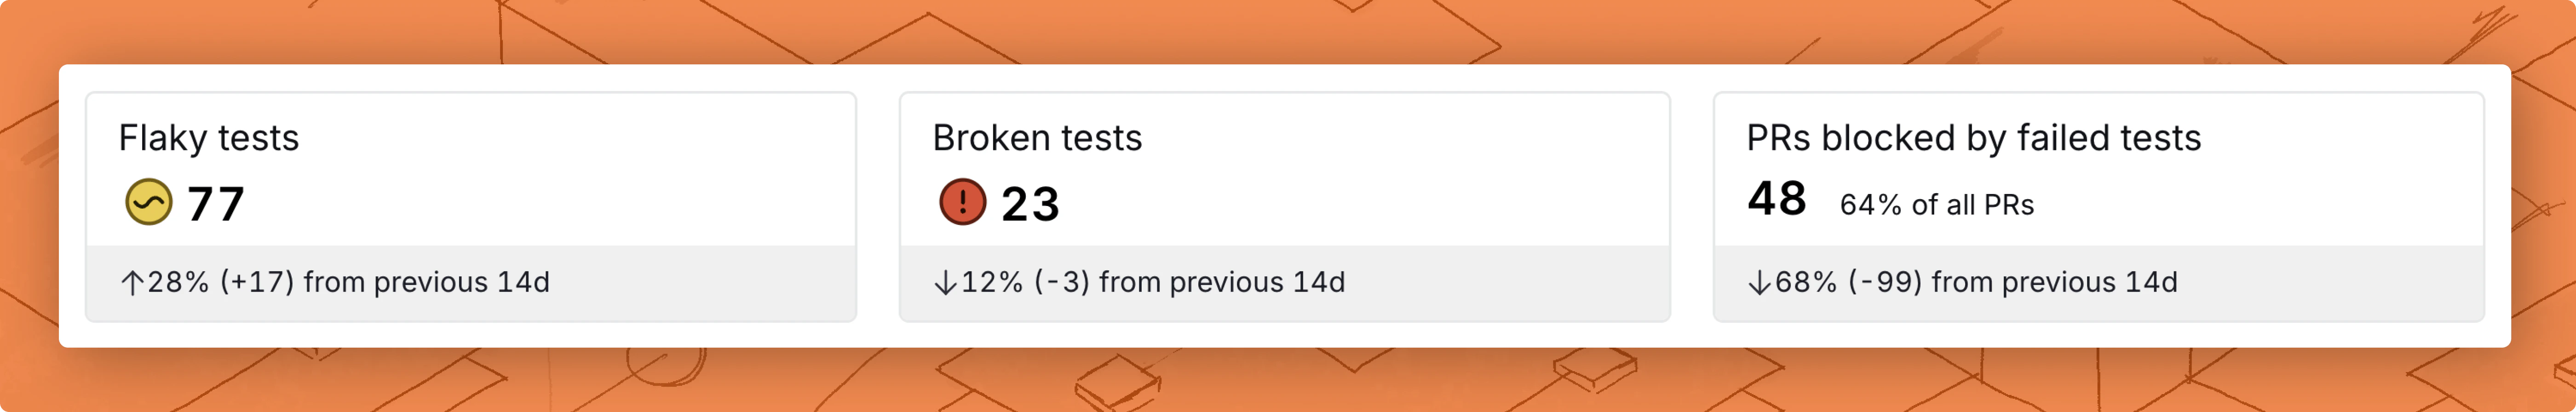
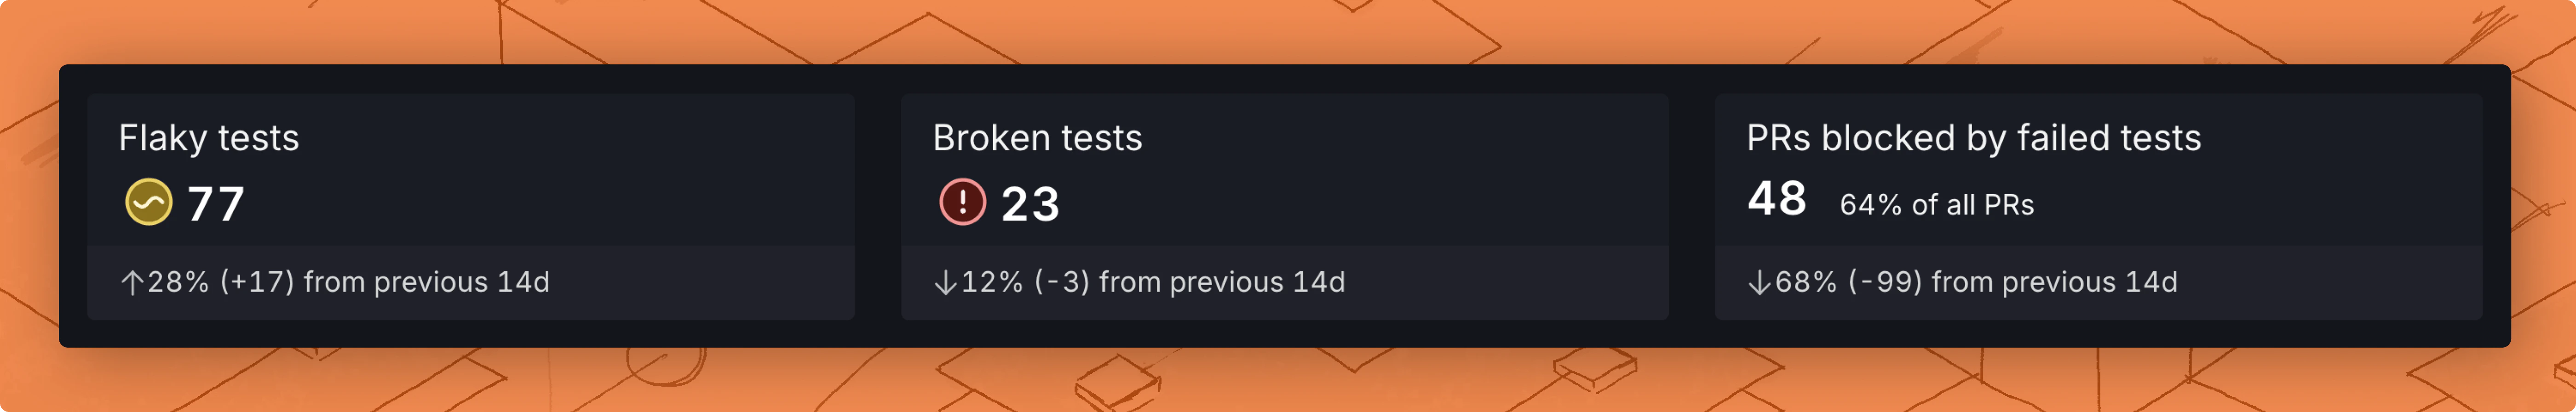
Key repository metrics
Trunk Flaky Tests provides key repo metrics based on the detected health status of your tests. You’ll find metrics for the following information at the top of the Flaky Tests dashboard.
| Metric | Description |
|---|
| Flaky tests | Number of flaky test cases in your repo. |
| PRs blocked by failed tests | PRs that have been blocked by failed tests in CI. |
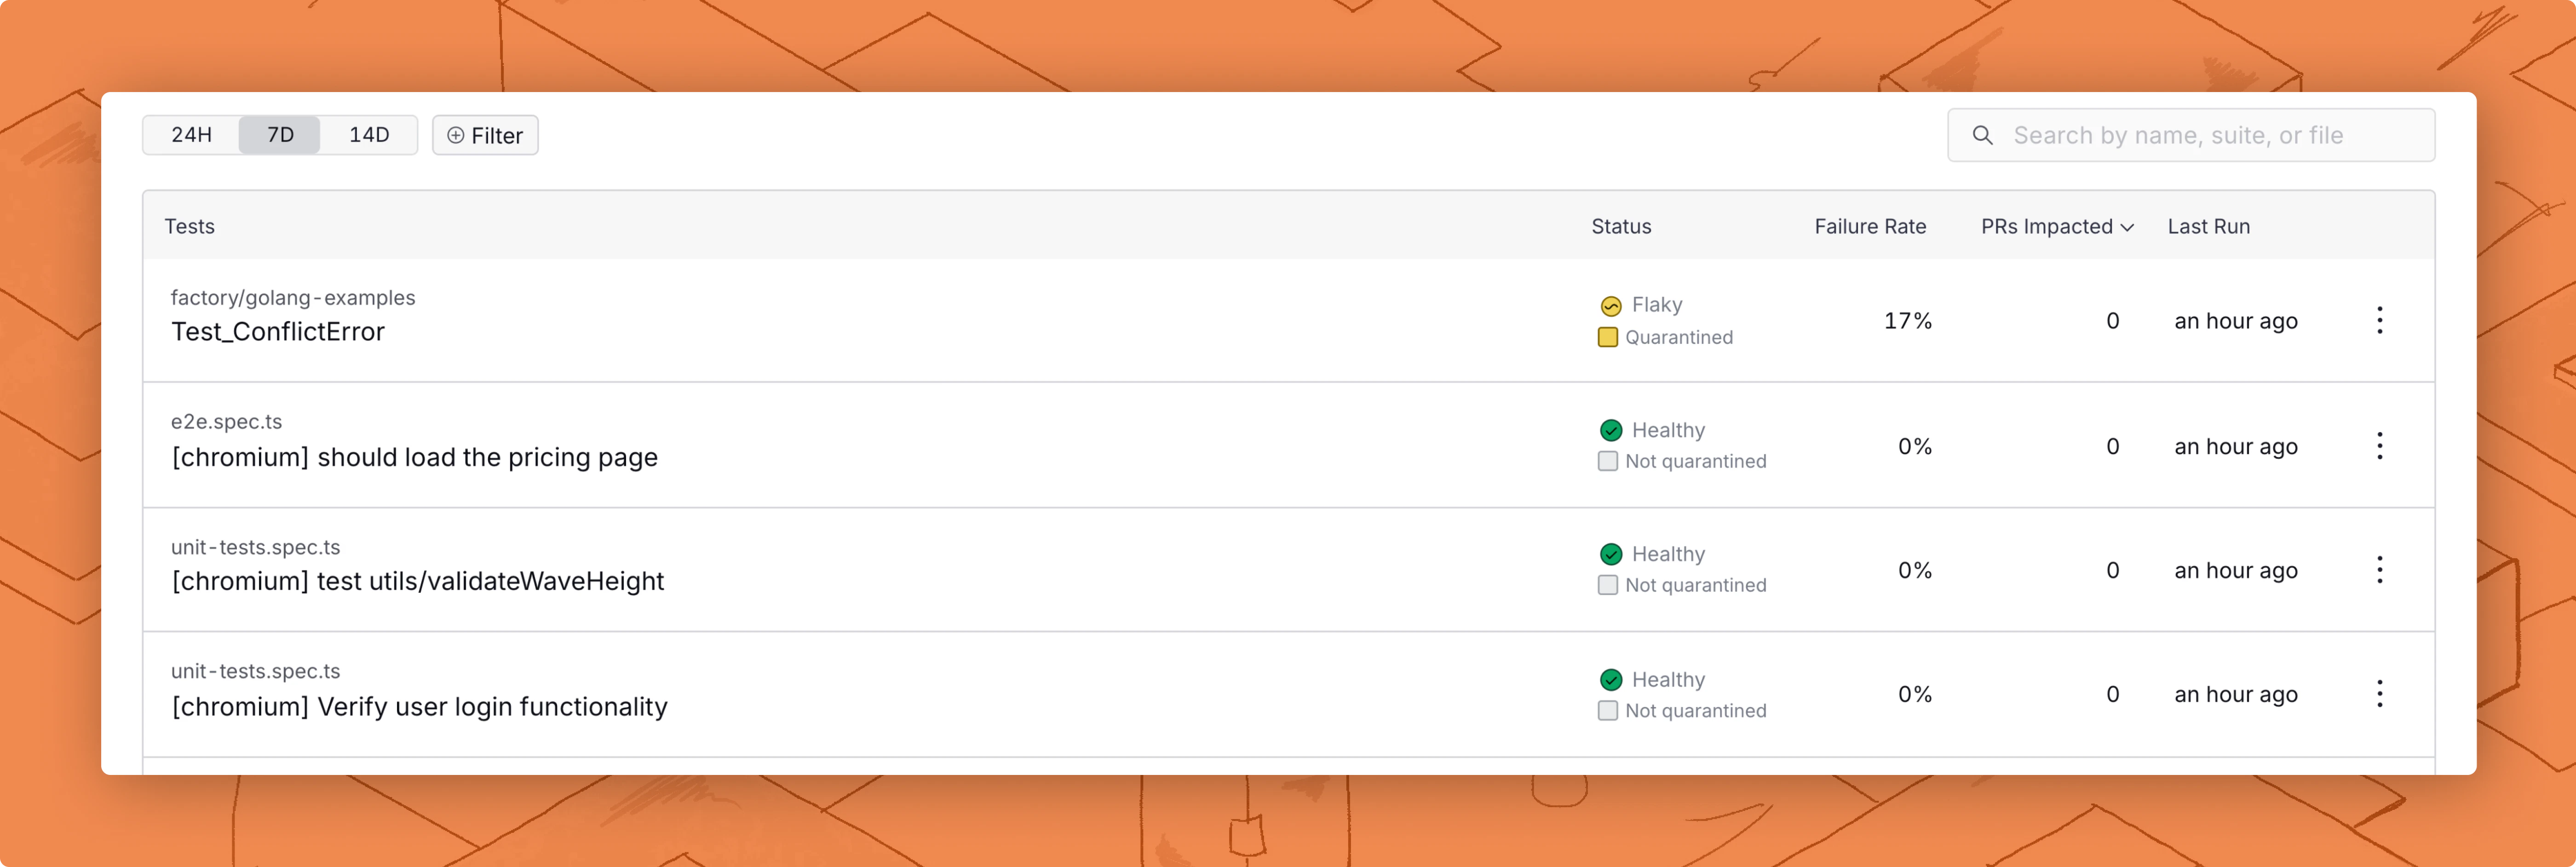
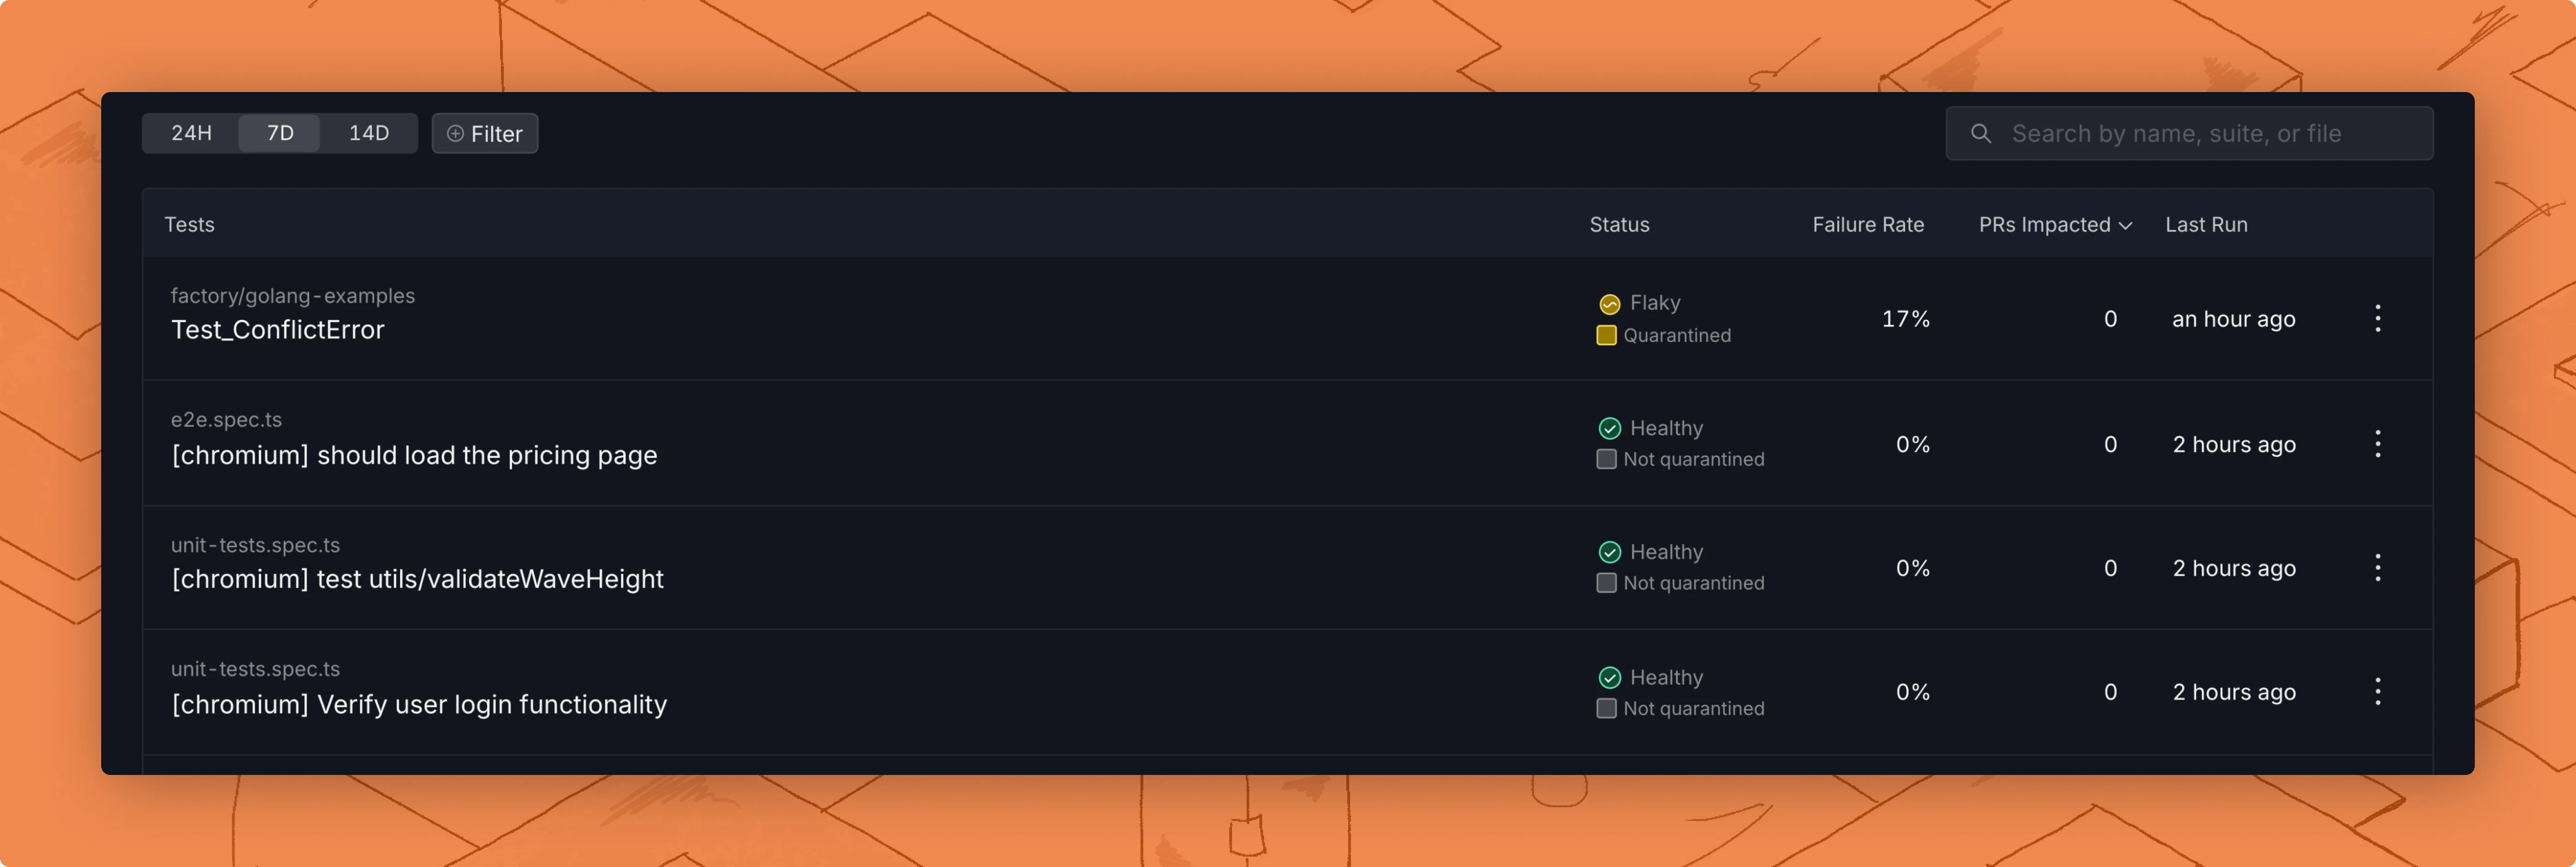
Tests cases overview
You can view a table of all your test cases and their current status in Trunk Flaky Tests.
Filters can also be set on the table to narrow test results down by test status, quarantine setting, ticket status, or by the name, file, or suite name of the test case.
The table is sorted by default by the number of PRs impacted by the case, which is the best way to measure the impact of a flaky test. You can click on each test case to view the test case’s details.
| Column | Description |
|---|
| Tests | The variant, file path, and name of the test case. |
| Status | The health status of the test case: Healthy, Flaky, or Broken. Broken indicates consistent high-rate failures; Flaky indicates intermittent failures. |
| Failure Rate | The percentage of CI runs failed due to this test case. |
| PRs Impacted | The number of PRs that have been affected by this test case failing in CI. |
| Last Run | The most recent timestamp for an upload test run. |
Test Deletion & History
- Inactive tests disappear from the dashboard automatically after 30 days and are fully removed after 45 days. Tests cannot be manually deleted.
- Changing test identifiers (e.g., adding file paths) creates new test entries — merging with old history isn’t supported.
Test case details
You can click on any of the test cases listed on the Flaky Tests dashboard to access the test case’s details. The test details page uses a tabbed layout:
- Summary: Run result charts and failure types grouped by unique failure reason.
- Test History: A searchable, paginated table of every individual test run with filtering and a detail panel.
- Monitors: Detection monitors configured for this test (visible when the detection engine is enabled).
- Events: A timeline of detection events, quarantine actions, ticketing events, and status transitions (Healthy, Flaky, Broken) for this test (visible when the detection engine is enabled). Use the category filter to scope to Flake Detection events to see which monitor triggered each transition.
In addition to the tabbed content, the test details page shows the test’s current status (Healthy, Flaky, or Broken), ticket status, and codeowner information.
Code owners
If you have a codeowners file configured in your repos, you will see who owns each flaky test in the test details view. We support code owners for GitHub and GitLab repos.
This information will also be provided when creating a ticket with the Jira integration or webhooks.
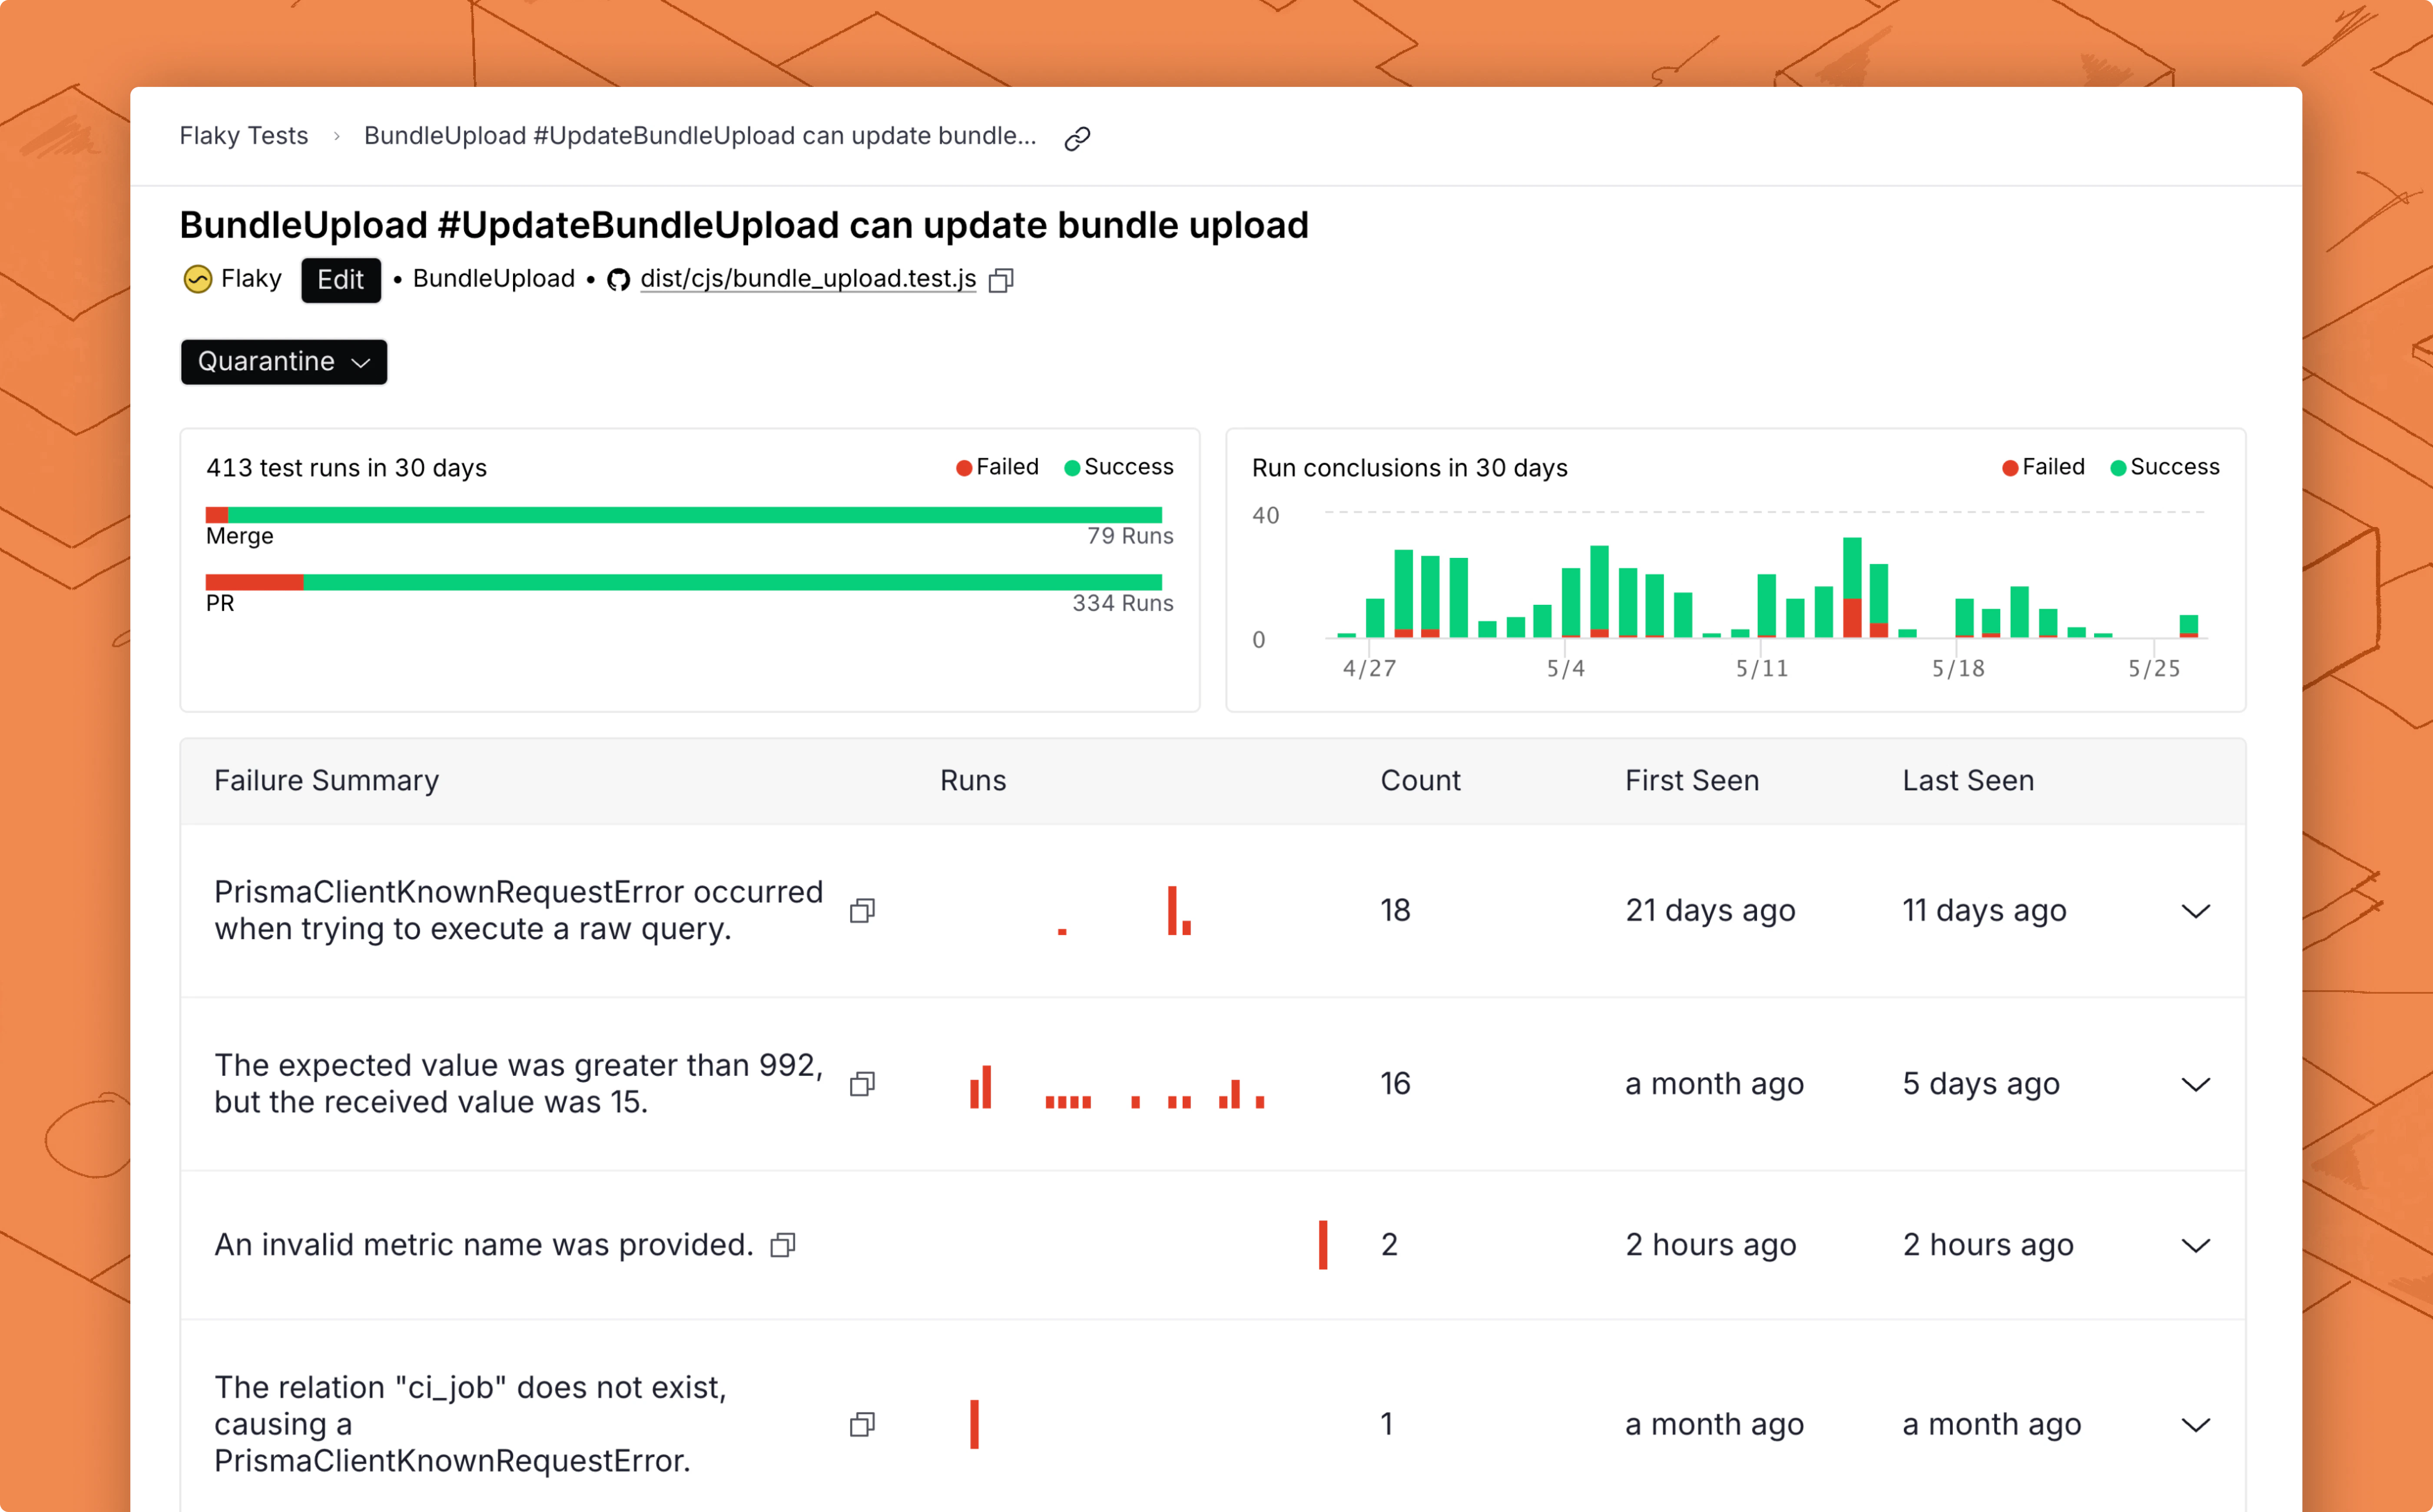
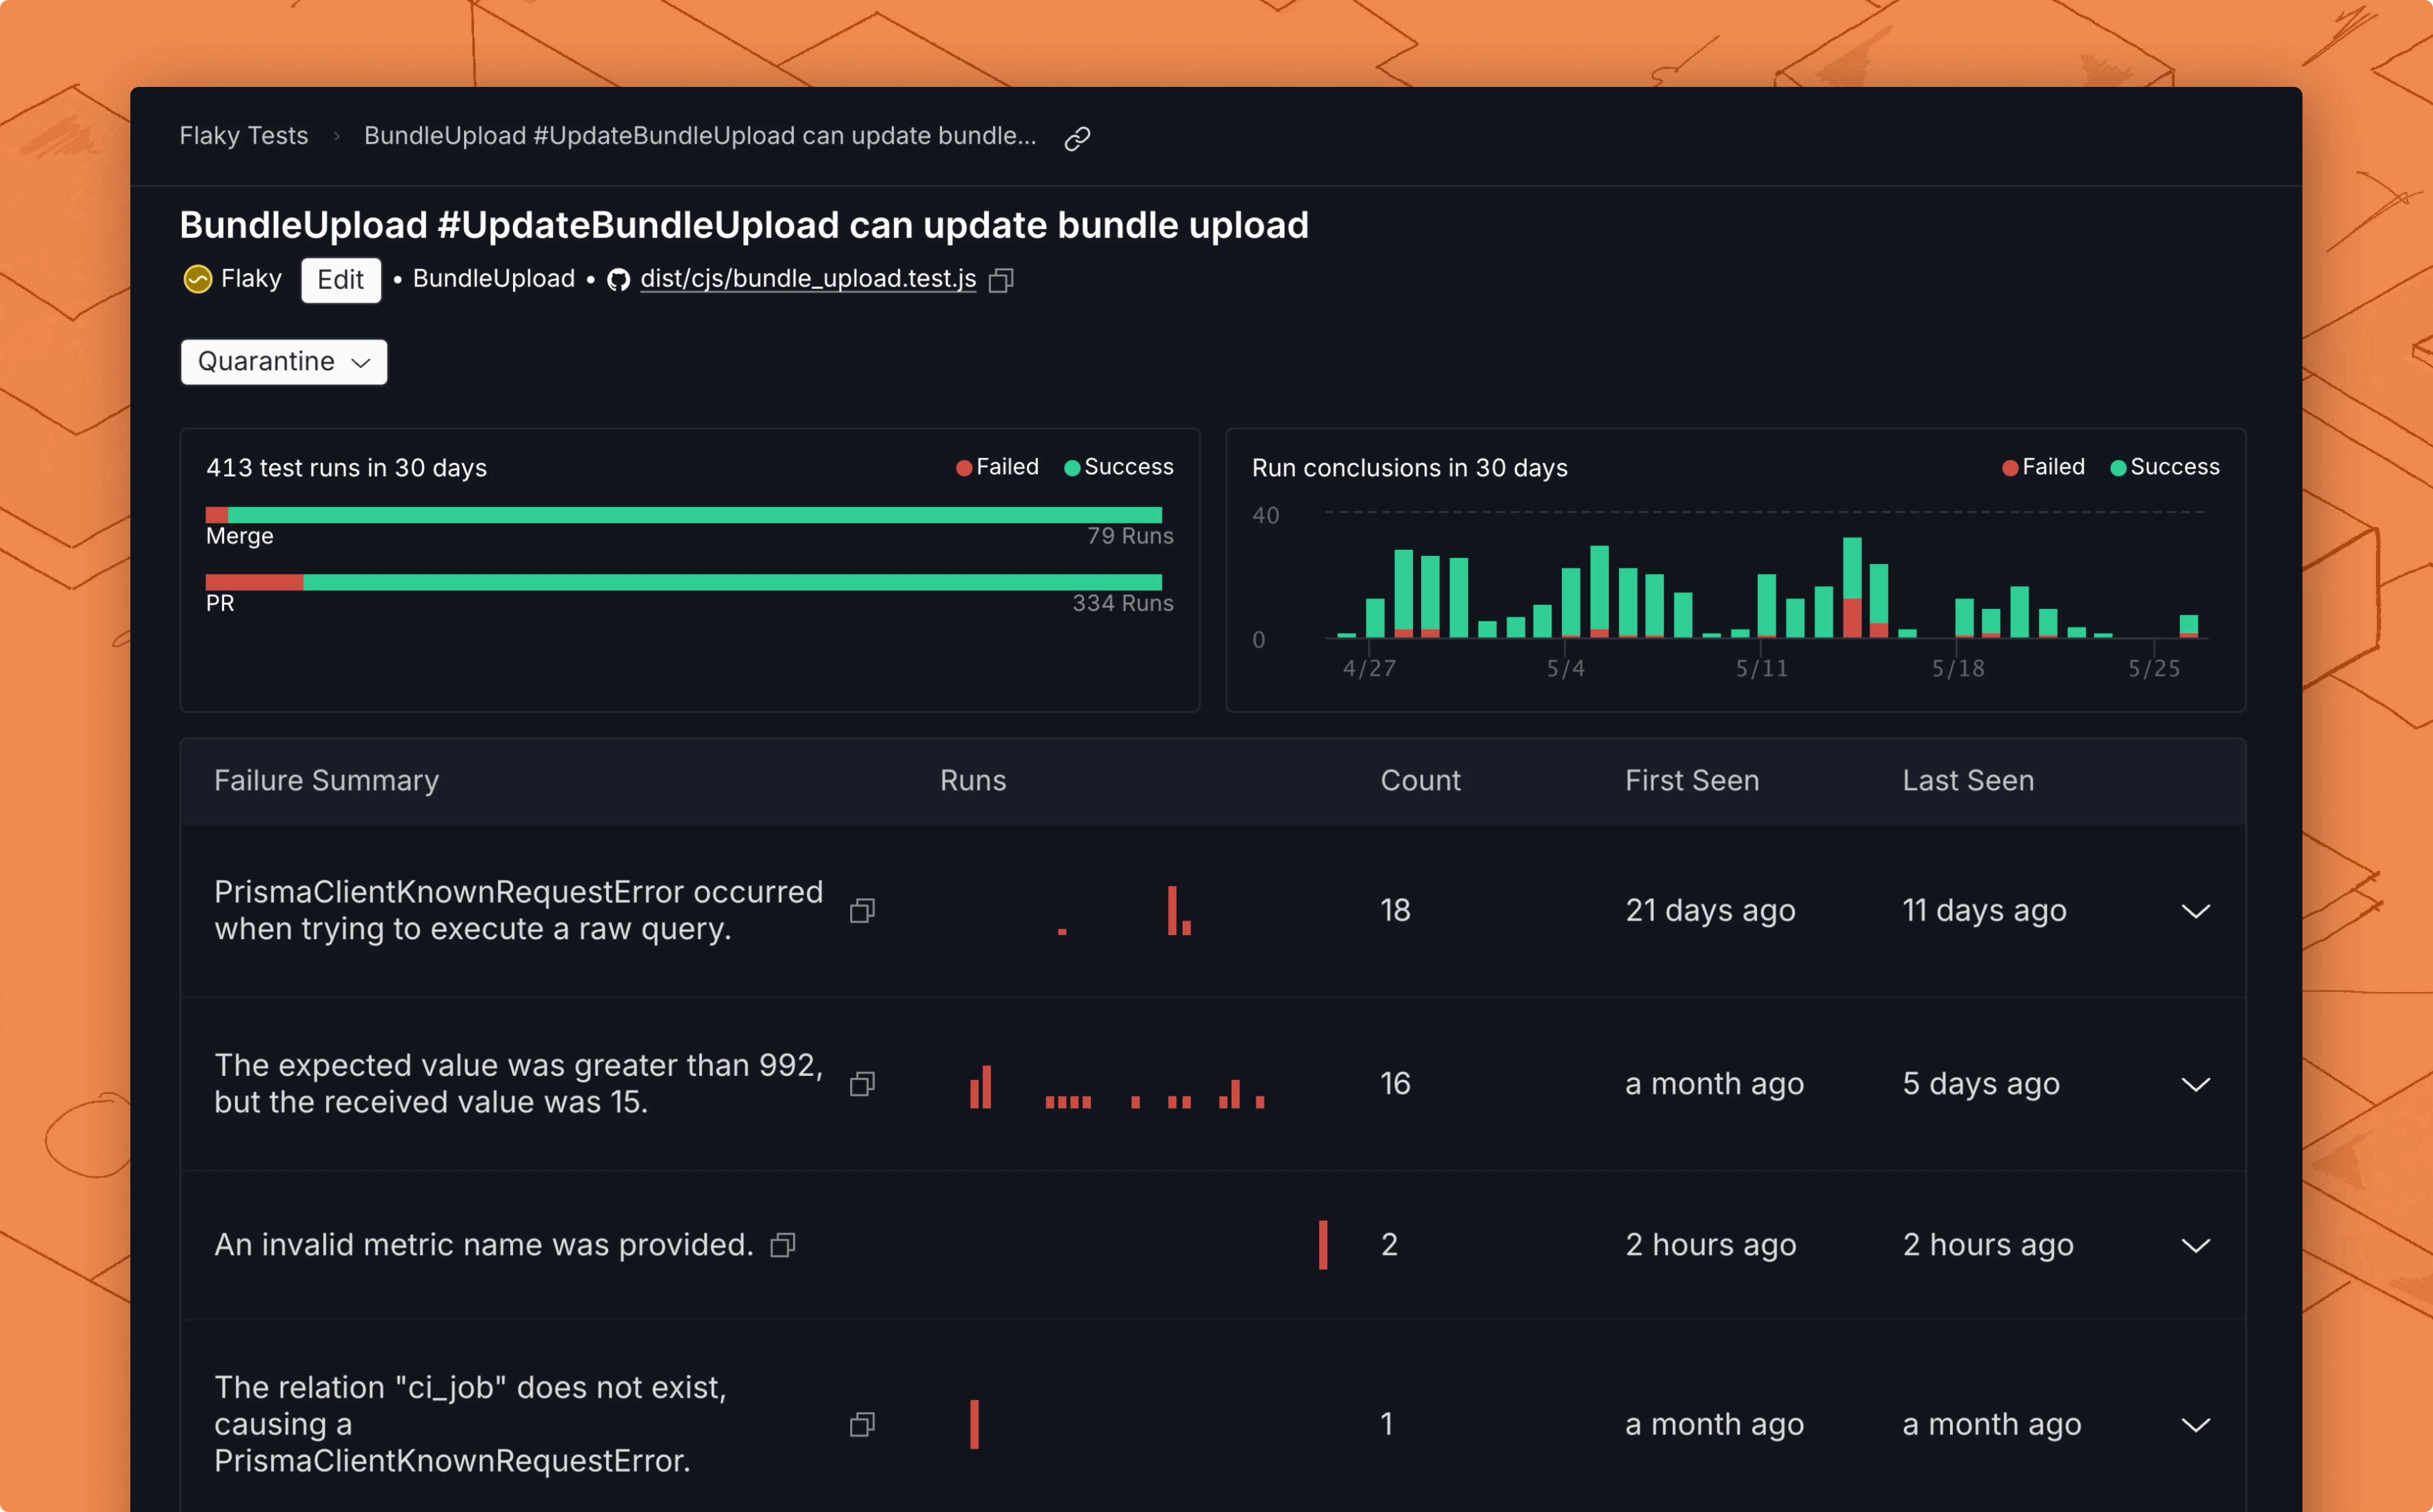
Summary tab
The Summary tab shows an overview of the test’s recent run results and groups past failures by unique failure type.
Failure types
The Failure Types table shows the history of past test runs grouped by unique failure types.
The Failure Type is a summary of the stack trace of the test run. You can click on the failure type to see a list of test runs labeled by branch, PR, Author, CI Job link, duration, and time.
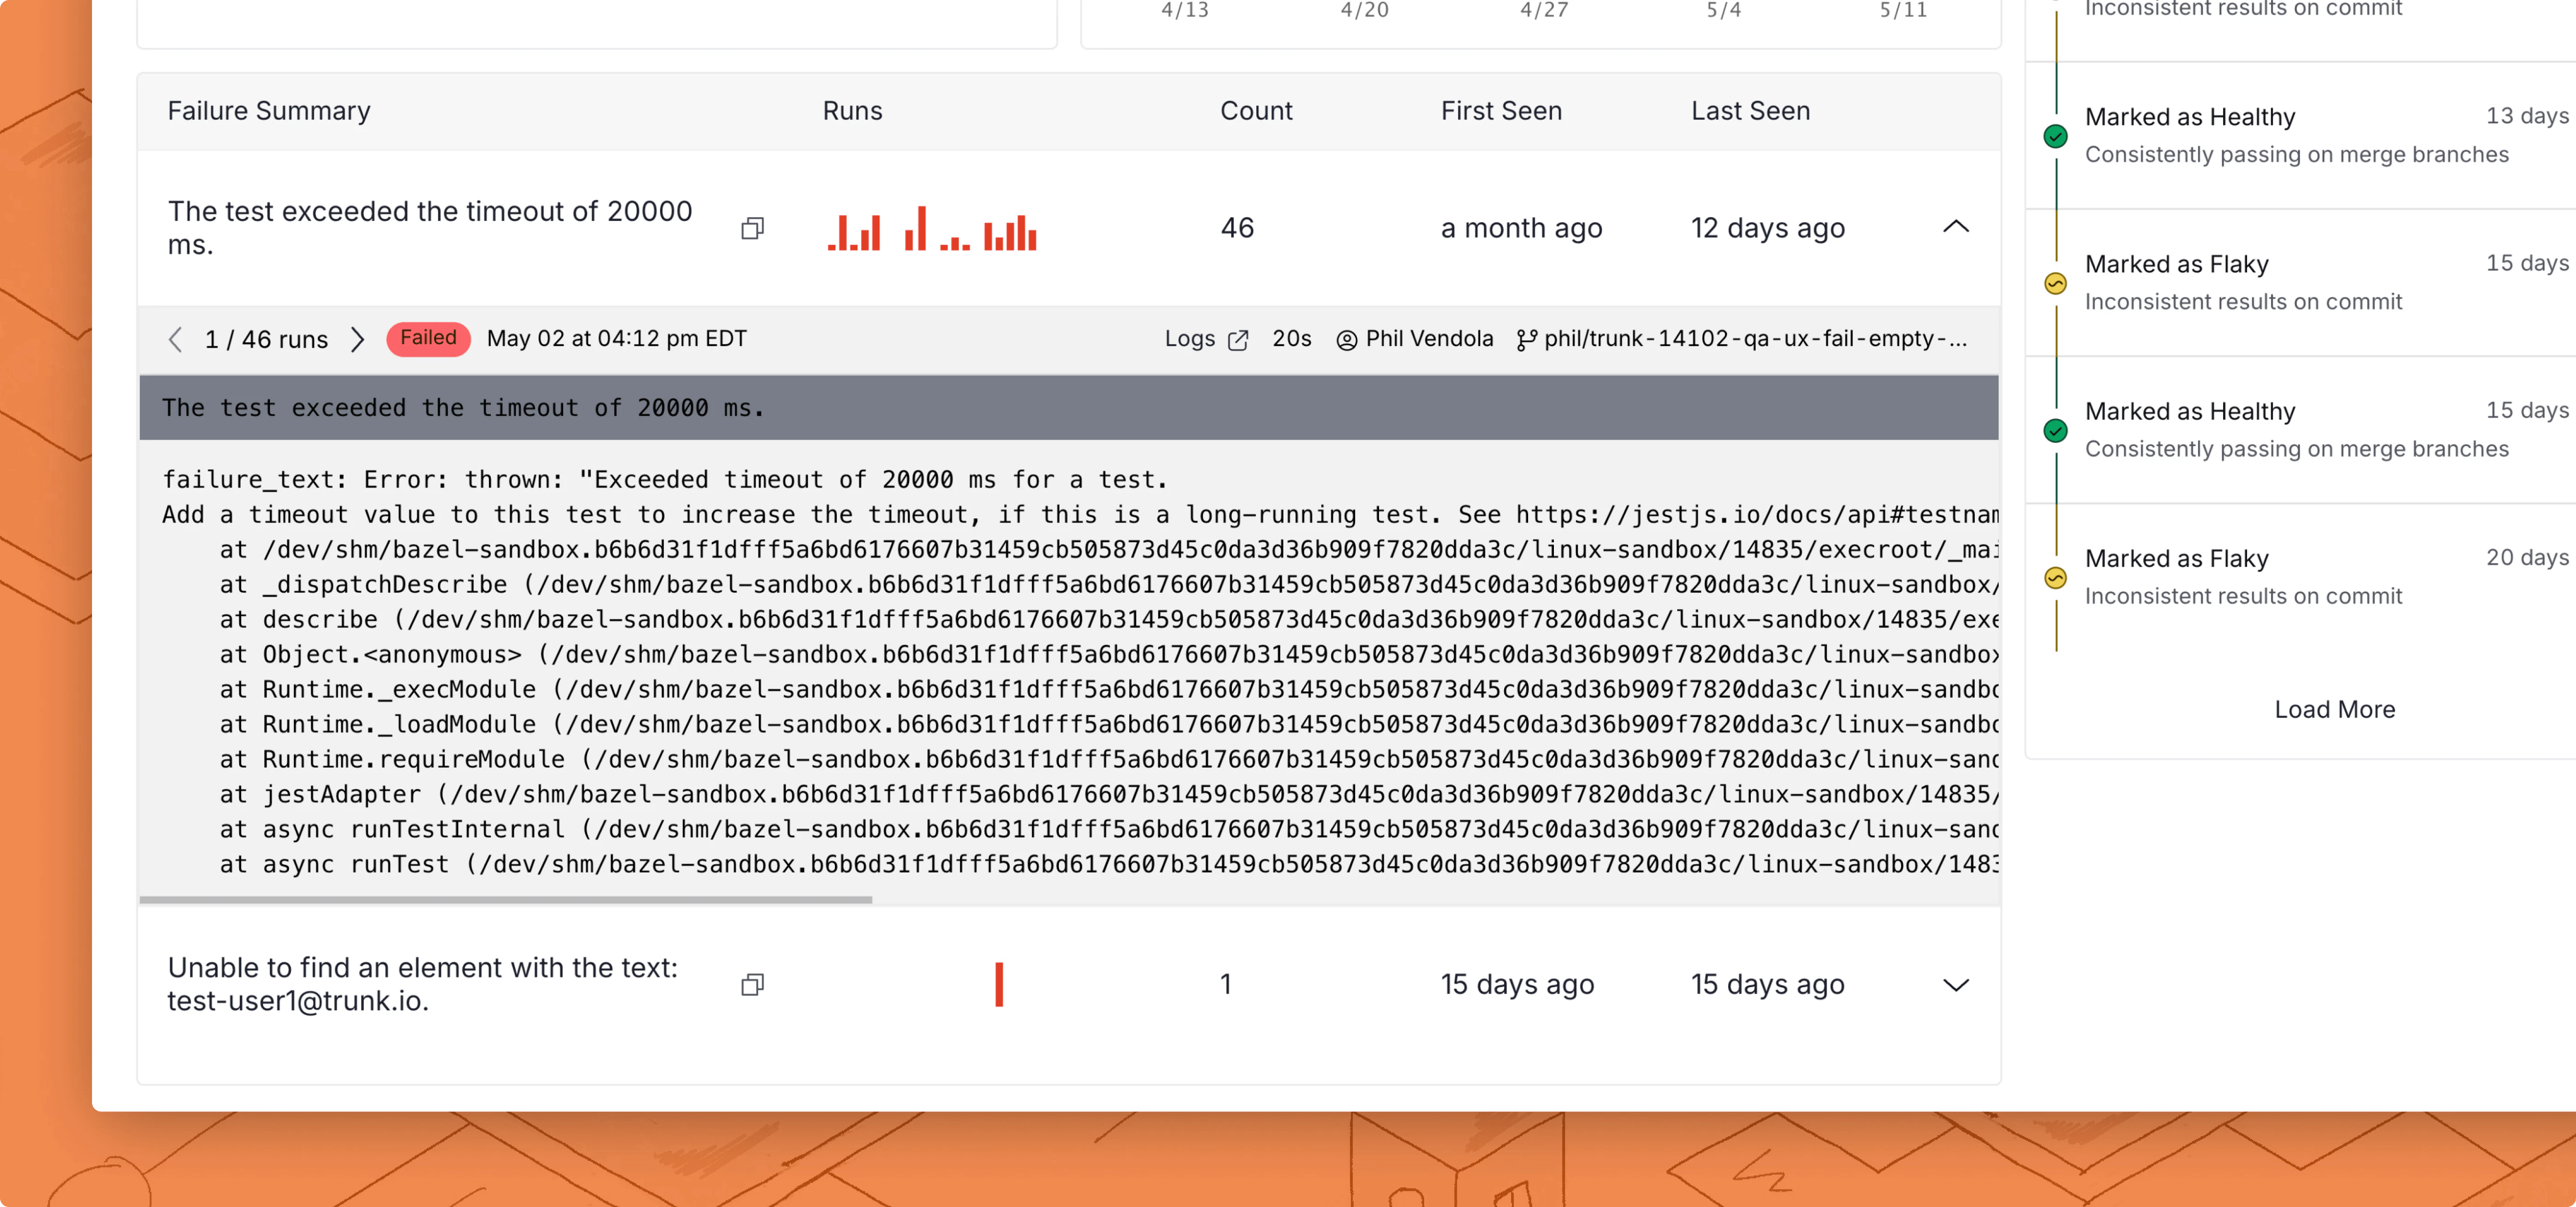
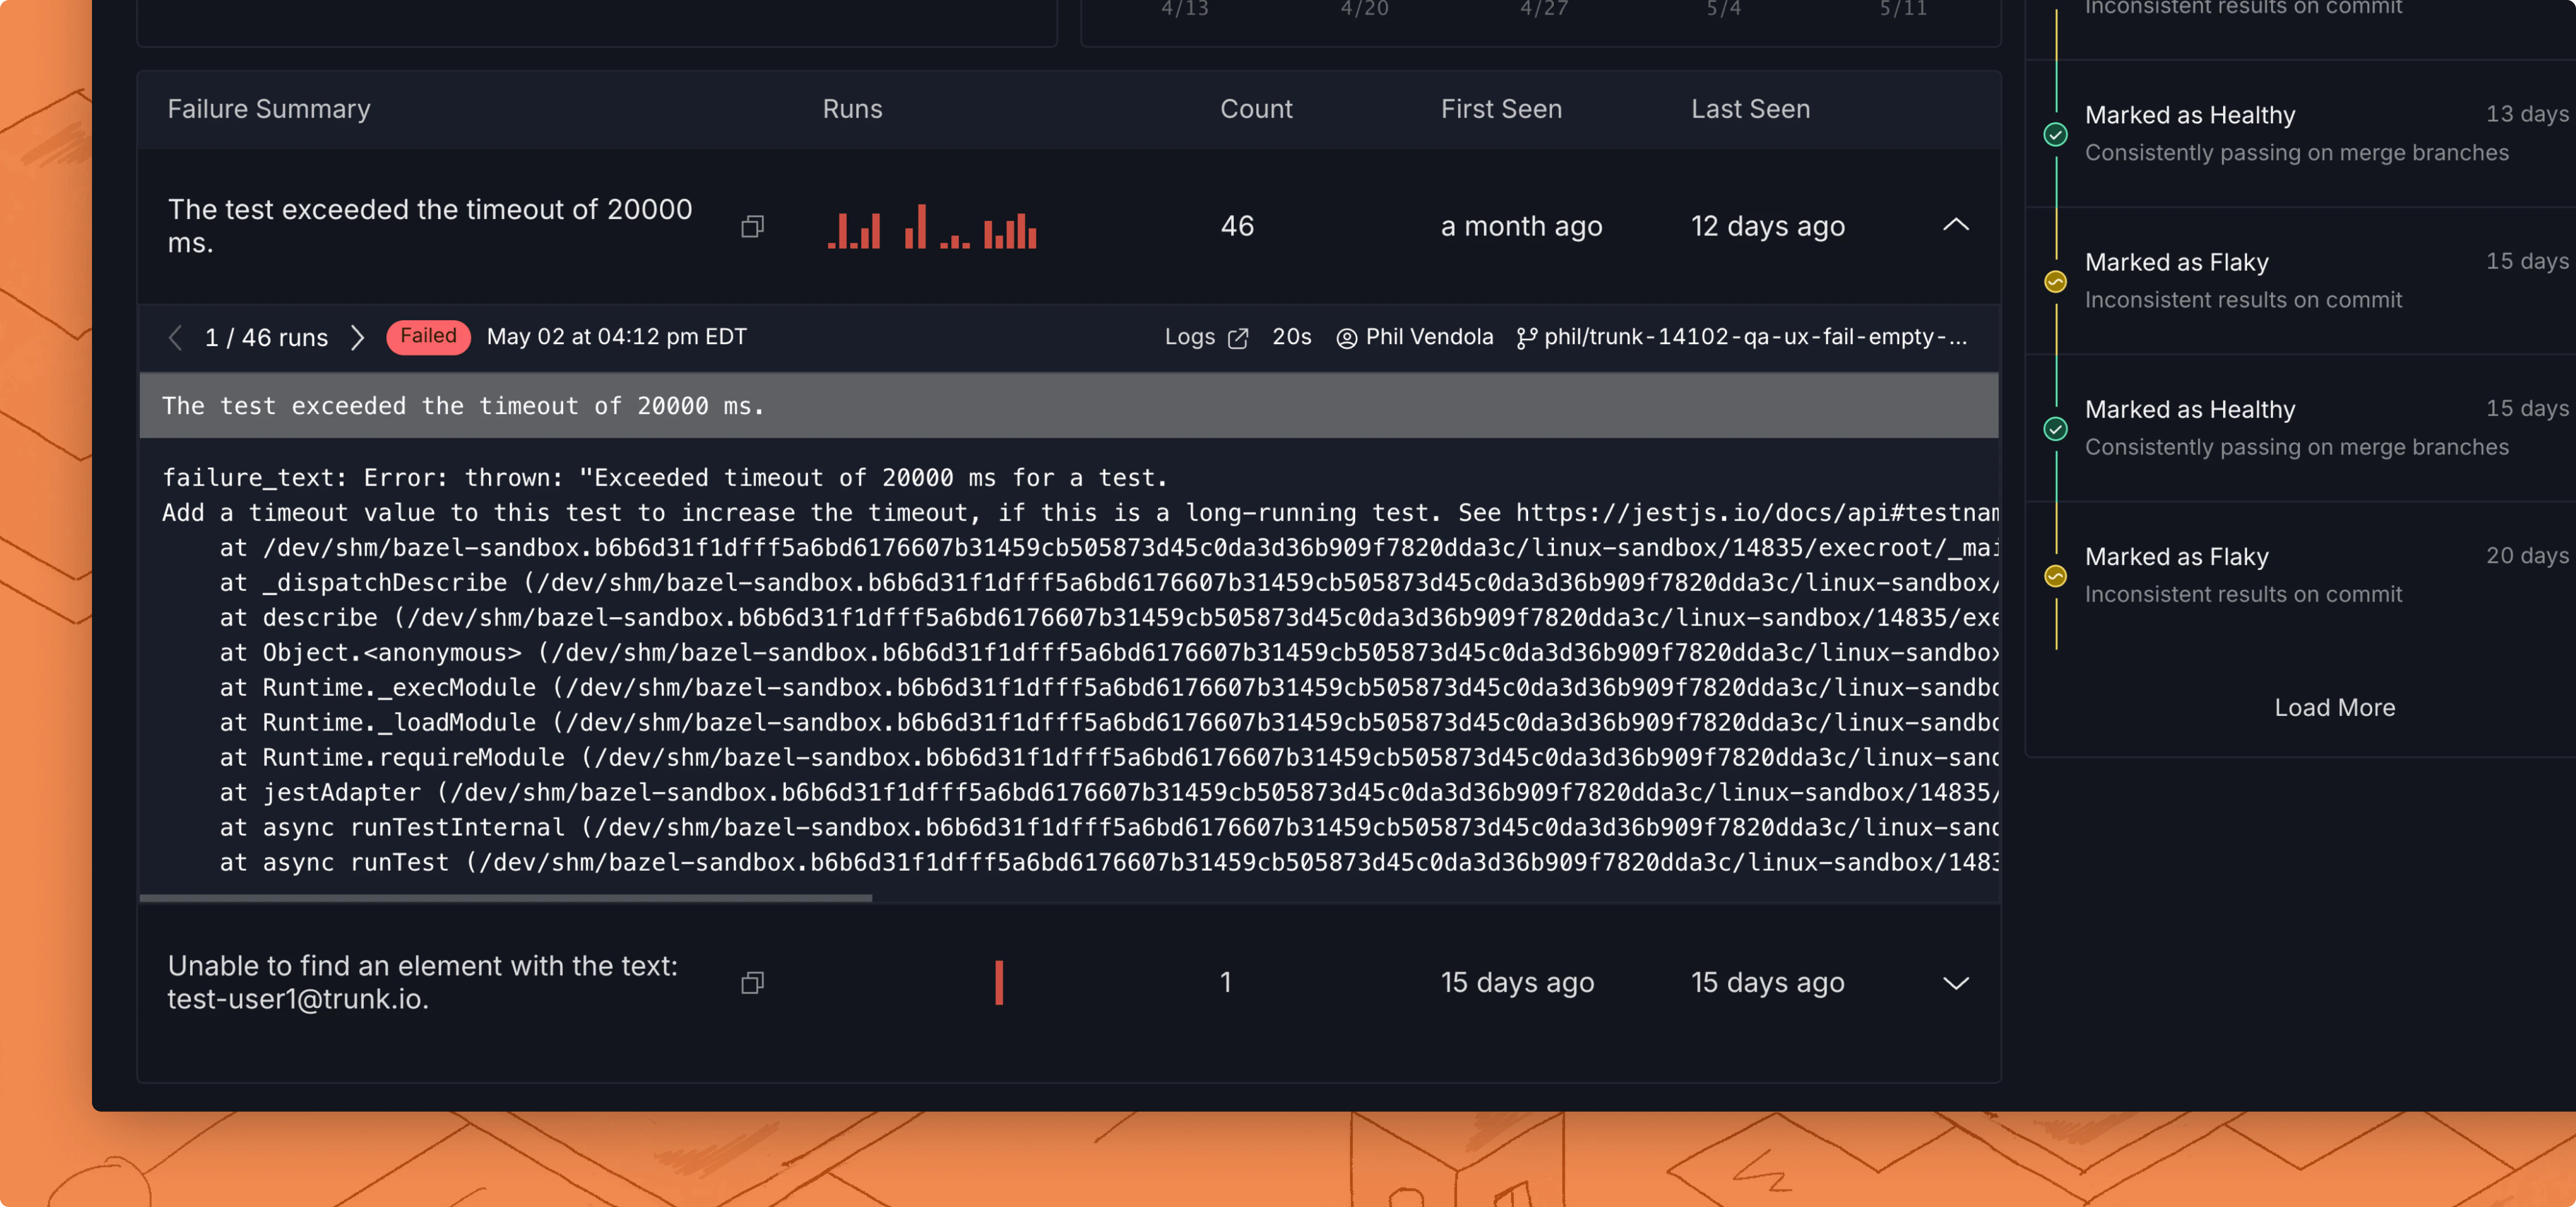
Failure details
You can click on any of these test runs to see the detailed stack trace:
You can flip through the stack traces of similar failures across different test runs by clicking the left and right arrow buttons. You can also see other similar failures on this and other tests.
Go to the CI job logs
If you want to see full logging of the original CI job for an individual test failure, you can click Logs in the expanded failure details panel to go to the job’s page in your CI provider.
Test History tab
The Test History tab gives you full visibility into every individual run of a test. Use it to investigate patterns across branches, find specific failing runs, and drill into error details.
Daily runs chart
A stacked bar chart at the top of the tab shows daily test run counts. The legend identifies four categories:
- Green: Pass
- Red: Fail
- Blue: Quarantined
- Gray: Skipped
Click and drag on the chart to select a date range, which scopes the table below to runs from the selected days. The selected range appears next to the legend with an X button to clear just the range. The Reset button on the filter bar clears all filters at once, including the date range.
The Result and Quarantined filters from the filter bar also apply to the chart bars. When you filter to only passing runs, for example, the chart shows only green (Pass) bars. The chart and table always reflect the same set of runs.
Filters
A filter bar below the chart provides four independent controls:
| Filter | Description |
|---|
| Result | Segmented control with All, Pass, and Fail to scope the table to a specific outcome. |
| Quarantined | Segmented control with Include (default), Exclude, and Only to control whether quarantined runs are mixed in, hidden, or shown exclusively. |
| SHA | Filter by commit hash. Matches runs whose SHA starts with the entered text. |
| Branch | Filter by branch name. Accepts exact names or glob patterns. Use * to match any sequence of characters and ? to match a single character. |
| Pattern | Matches |
|---|
main | The branch named main exactly |
release/* | All release branches, e.g. release/1.0, release/2.3 |
feature-?? | Feature branches with a two-character suffix, e.g. feature-v2 |
trunk-merge/* | All merge queue branches |
result=pass or result=fail. The Quarantined filter accepts quarantined=include, quarantined=exclude, or quarantined=only.
Runs table
The runs table displays a paginated list of individual test runs (25 per page) with the following columns:
| Column | Description |
|---|
| Timestamp | When the test ran, displayed in your local time zone. |
| Duration | How long the test took to execute. |
| PR | The pull request number associated with the run, e.g. #1234. Empty for runs that aren’t tied to a PR. |
| Branch | The branch the test ran against, e.g. main, feature/x, or trunk-merge/pr-1234/... for merge queue branches. |
| Commit | The first 7 characters of the commit SHA. |
Run detail panel
Click any row in the runs table to open a detail panel on the right side of the page. The panel shows:
- Run header: Timestamp, a result badge (Pass, Fail, Error, or Quarantined), and run duration.
- Source control: A CI job link (with the provider’s icon, the job name, and the CI duration), the linked pull request, branch, and commit. Merge queue runs also include a View in Merge Queue link.
- Error details: For failed, errored, or quarantined runs, an optional AI summary of the failure followed by the raw error text or stack trace.
Debugging a flaky test from the UI
The Summary tab, failure details, and Test History tab give you most of what you need to investigate a flaky test. A few gaps come up often enough to call out, along with the workarounds that exist today.
Drilling into the right parallel worker
The CI job link in the run detail panel points to the parent build, not the specific worker that produced the failure. If your CI runs a single job, this is fine. If you fan out across many parallel workers (some customers run 40+), you’ll have to click through workers in the CI provider to find the one whose log contains the failure.
To shortcut this, capture the per-worker URL at test run time and include it in your JUnit output so it surfaces in the failure detail. Most CI providers expose an environment variable for the running job’s URL:
| CI provider | Environment variable |
|---|
| CircleCI | CIRCLE_BUILD_URL |
| GitHub Actions | ${GITHUB_SERVER_URL}/${GITHUB_REPOSITORY}/actions/runs/${GITHUB_RUN_ID} |
| Buildkite | BUILDKITE_BUILD_URL |
| GitLab CI | CI_JOB_URL |
Bundle Upload ID lookups
When the trunk-analytics-cli uploads a bundle, it prints a Bundle Upload ID to the job log. This ID does not currently map to a URL in the web app — there’s no search field for it in the dashboard. If you need to trace a specific upload back to its run data, contact support with the Bundle Upload ID.
Uploads can take up to 10 minutes to populate run data in the dashboard. If a run you just uploaded isn’t visible yet, wait and refresh before assuming the upload failed.
CI artifact retention
CI providers typically retain build artifacts (screenshots, videos, traces) for one to two days. Flaky test tickets often take longer than that to investigate and resolve, which means the artifacts that would have helped explain the failure may already be gone by the time you open the ticket.
If artifacts matter for your debugging flow, store them outside the CI provider’s retention window:
- Upload screenshots, videos, and traces to S3 (or another long-lived store) as a CI step, and include the object URL in the JUnit output alongside the per-worker URL described above.
- For especially noisy tests, attach the artifact URL to the Jira/Linear ticket Trunk opens via the ticketing integration.
Known limitations
A few framework-specific quirks are worth knowing about up front.
RSpec MultipleExceptionErrorWhen an example raises multiple exceptions (for example, an error in the test body plus a separate error in an after hook), RSpec wraps them in RSpec::Core::MultipleExceptionError. The failure detail view currently surfaces only one of the captured exceptions. The rspec_trunk_flaky_tests gem is being extended to extract the full set; until that ships, check the CI job logs for the full exception list when you see this error type.
Go subtests with 0ms durationgo test reports the top-level test duration but does not always emit per-subtest durations. When the duration arrives as 0ms, the AI failure analysis can mistake a slow subtest for an instantaneous one and miss timing-related context. Post-process your JUnit XML to reflect real subtest durations before uploading, or rely on the raw stack trace rather than the AI summary for these cases.